Goals
- Understanding Coordinates
- Drawing Basic Shapes
- Points
- Ellipses
- Lines
- Rectangles
- Drawing Advanced Shapes
- Triangles
- Quads
- Arcs
- Curves
Reading
-
Learning Processing: Chapter 1 + 2
Resources
Traditional Cartesian Coordinates
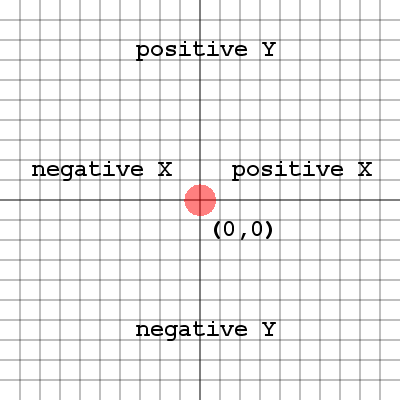
In a traditional Cartesian coordinate system, there are four quadrants (sections) around the origin which is at the center. The quadrants are divided by the x axis and y axis. An axis is the line that runs across the coordinate system, while the other coordinate value remains at 0. Each quadrant corresponds to a set of negative, positive pairs of x and y values. Quadrant 1 for example is the upper right quadrant with positive x and y values. Quadrant 2 is the upper left quadrant with negative x values and positive y values. The quadrants are numbered in the counter-clockwise direction.
Processing Coordinates
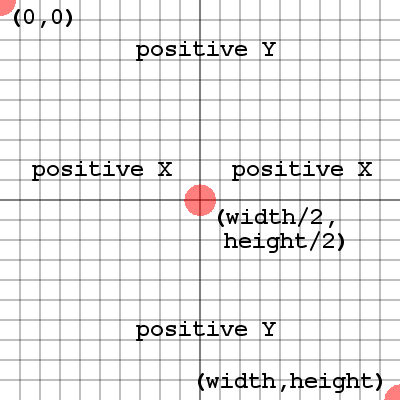
In Processing, we are still using a Cartesian Coordinate System. However in this system the y axis is flipped, and the origin (0, 0) is now in the top left corner. Having the y axis flipped means that moving down the window will be increasing positive y values. The x values are the same, but remember that (0, 0) is now the top left corner of the sketch window. The bottom right corner of the sketch is (width, height) where width and height represent the size of the sketch window. The center of the sketch is (width/2, height/2). In the sketch window we are in quadrant 1 of a Traditional Cartesian Coordinate System with the y axis flipped.
Points
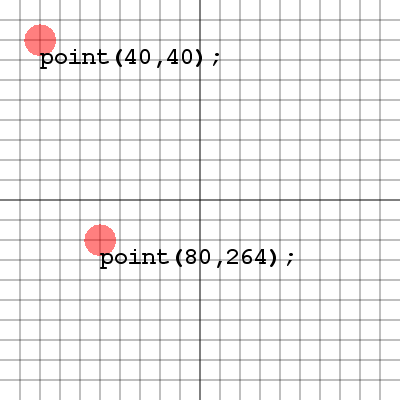
Drawing points is often referred to as "plotting" points.
The method to place a point is:
point( x, y );
The x argument is the amount of pixels from the left side of the sketch window.
The y argument is the amount of pixels from the top of the sketch window.
Lines
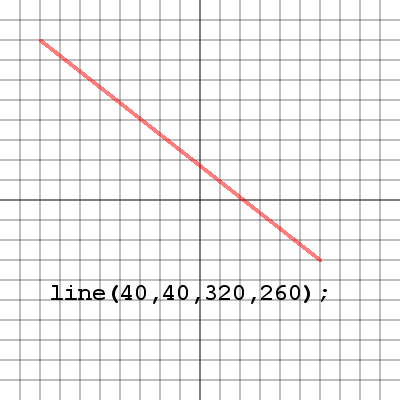
Lines are basically connecting two points.
Once you learn to plot points, you can make lines.
The method to draw a line is:
line( x1, y1, x2, y2 );
The x1, y1 arguments are the location of the start point of the line.
The x2, y2 arguments are the location of the end point of the line.
Ellipses
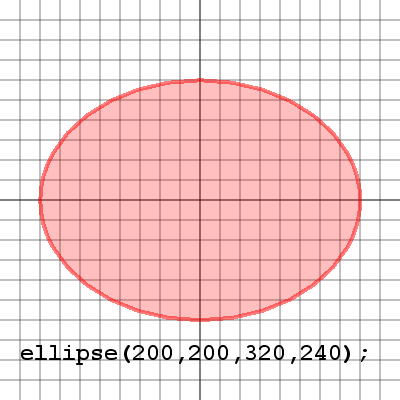
Ellipses are a bit different than lines and points.
First you place the center point of the ellipse.
Then you specify the width and height of the ellipse.
The method to draw an ellipse is:
ellipse( x, y, width, height );
The x, y arguments are the location of the center of the ellipse.
The width, height arguments are how wide and tall the ellipse will be around the center.
Rectangles
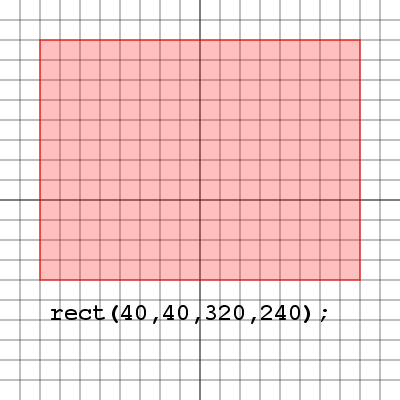
Rectangles are a bit different than ellipses.
First you place the top left corner of the rectangle.
Then you specify the width and height of the rectangle.
The method to draw a rectangle is:
rect( x, y, width, height );
The x, y arguments are the location of the top left corner of the rectangle.
The width, height arguments are how wide (right) and how tall (down) the
rectangle will be.
Triangles
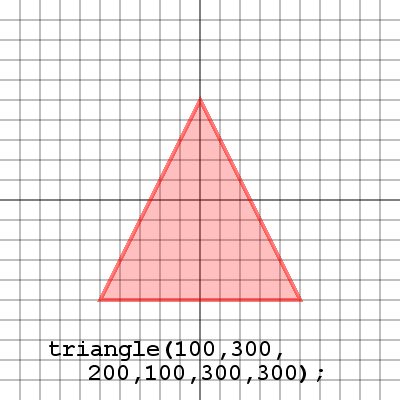
Triangles are as easy as plotting 3 points
First place the start point for the triangle.
Then place the next two points for the triangle.
A line will be drawn connecting the first and third points.
The method to draw a triangle is:
triangle( x1,y1,x2,y2,x3,y3 );
Each set of x, y arguments corresponds to each point in the triangle.
Quadrilaterals
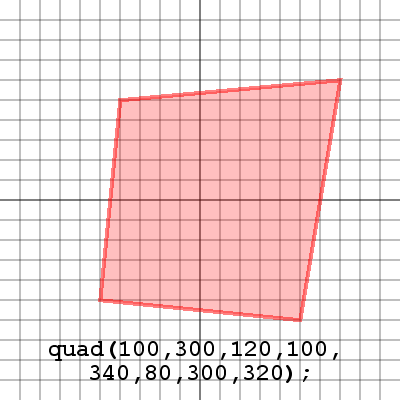
Quadrilaterals are like triangles except they use 4 points.
First place the start point for the quad.
Then place the next three points and a line will be drawn between the first and fourth points.
The method to draw a quad is:
quad( x1,y1,x2,y2,x3,y3,x4,y4 );
Each set of x, y arguments corresponds to each point in the quad.
Arcs
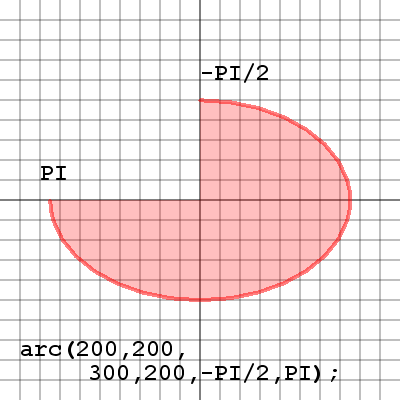
Arcs are a lot like ellipses, with a bit more flexibility.
First draw an ellipse as you would like to see it on screen.
Next the start angle for the arc.
Next the stop angle for the arc.
The method to draw an arc is:
arc(
x1,y1,width,height,start,stop );
The first four arguments are just like an ellipse.
The start, stop arguments are the start and end angles of the arc.
Curves
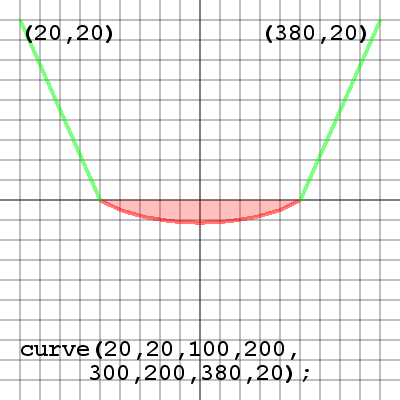
Curves are a totally different shape.
First place the starting control point, this will pull through the first point of the curve.
Next place the start and end points of the curve.
Last place the end control point which will pull through the end point of the curve.
The method to draw a curve is:
curve(x1,y1,x2,y2,x3,y3,x4,y4);
x1, y1 are the location of the start control point.
x2, y2 are the location of the start point.
x3, y3 are the location of the end point.
x4, y4 are the location of the end control point.