Goals
- Data Viz - Overview
- Using Data - Map, Min, Max
- Visual Representations
- Linear: Bars and Points
- Radial: Arcs and Segments
- Twitter API - Using Real Data
Resources
Data Visualization
Visualizing Data - Book
Data Visualization Overview
Data Visualization is a field that concerns itself with how we see and perceive information. There's an incredible amount of data in the world, but it's all just numbers if we can't see the patterns in it. Good data visualization not only shows the meaning of the data, but tells a story.
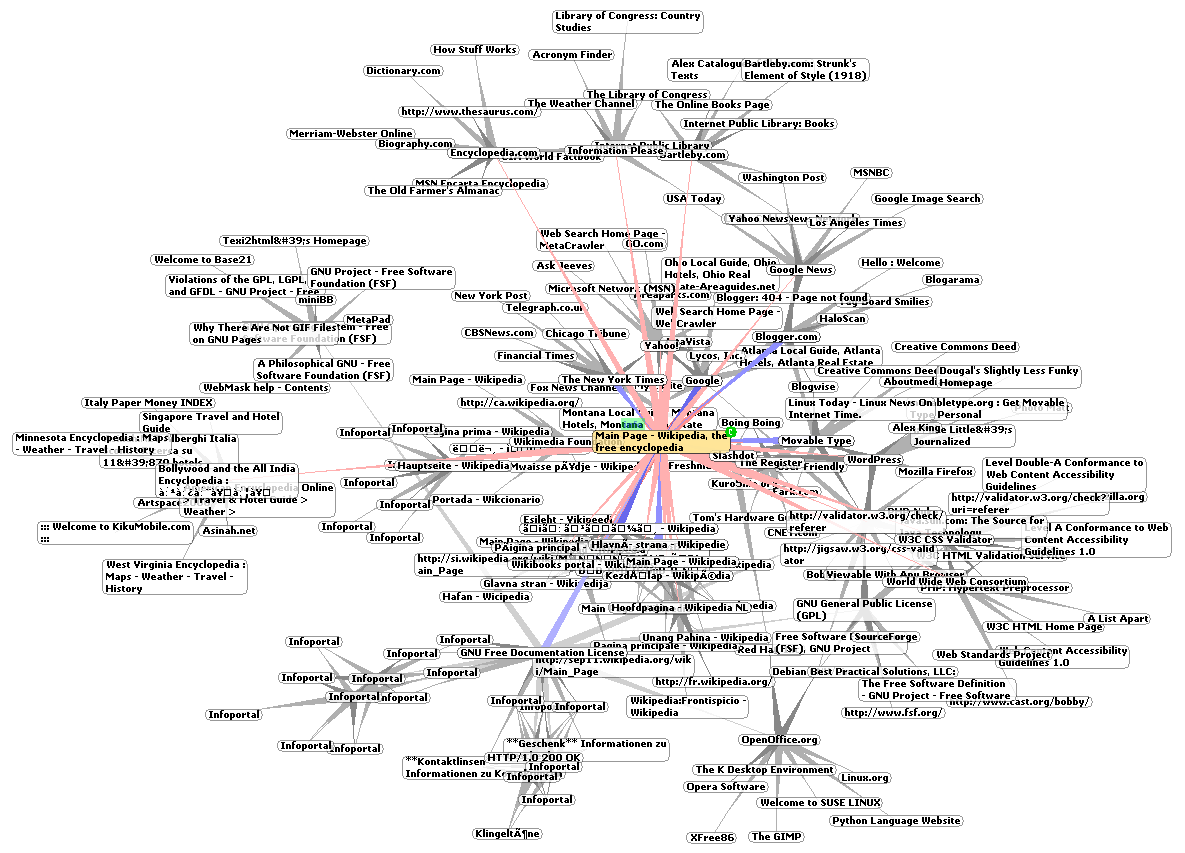
This image is a representation of Wikipedia as part of the world wide web represented by hyperlinks.
The Field
Data Visualization encompasses a number of different areas:
- Mindmaps
- Displaying news
- Displaying data
- Displaying connections
- Displaying networks
- Displaying websites
- Tools and services
Other areas related to Data Visualization are: information graphics, information visualization, scientific visualization, and statistical graphics.
Using Data
When making visualizations with data, we need to know a few things beyond what the plain numbers will tell us.
If we're too plot a correct graph, or points for example, we're going to want to maximize our screen space.
There are some useful methods available in processing to help us with this.
Map
One of the most useful methods in processing is the map method. It takes as parameters: a variable, the possible range of values it can be, and lastly the desired range of output values.
Using the map method, we can convert numbers between 0 and 1 to a percentage between 0 and 100. Let's take a look:
map(value, 0, 1, 0, 100);
Notice how map has 5 parameters, the first is the variable holding the value.
The second and third are the possible values in the original range of that variable.
The fourth and fifth specify the output range.
The map method is not useful unless we store the new value somewhere. The method returns the new value like this:
float newValue = map(value, 0, 1, 0, 100);
Min and Max
The min and max methods are overloaded and have many forms:
Examples using min:
float result = min(value1, value2); ints or floats
float result = min(value1, value2, value3); ints or floats
float result = min(values); array of values
Probably the most useful is the array form of the min method. Since we can pass in an array of any size and it will return the minimum number in the array.
Why Bother With Map, Min, and Max?
You'll see in the following examples that these methods are indispensable when creating charts and graphs from data.
Take this problem for example:
You want to make a bar chart and full maximize the screen space. You have an array of numbers that is loaded dynamically, so
until it comes time to draw the chart you have no idea what the max or min values are, or even how many there are. That's where
looping and methods like map, min, and max are essential.
Visual Representations
There are many ways to visualize data. The most standard are the obvious, plot, bar, pie chart.
We'll take a look at how to quickly and efficiently create these basic visualizations since they are the foundations of many others and this will provide the necessary skills for working with data.
Linear Representations - Plots
Here is an example of a plot of data:
The numbers here are plotted from bottom to top, increasing in value. They also range from red to yellow increasing in value.
Notice how the width of each point is pre-computed before the loop and stored in the variable 'w'.
Also, look how the map method is used, in conjunction with the min and max methods to find the perfect placement and color for our values.
The height of each point is computed using the map method, but it's actually quite a simple calculation:The height of each point is computed using the map method, but it's actually quite a simple calculation:
float height = value / maxValue * (height - 50);
Linear Representations - Bars
Very similar to plotting data is a bar chart, here is an example:
All we've done here is draw a rectangle instead of an ellipse. Notice how the rectangle needed to be drawn from the bottom of the screen updwards (take a look at the y pos and height of the rectangle).
Radial Representations - Pie Chart
Radial representations are somewhat different. Each piece is based on an angle in the pie which is a percentage of the total pie. Also, each piece must know the angle of the piece that came before it, so that it can draw forward in the pie.
Take a look at the example and pay close attention to how the angles are calculated:
Notice how when we use the map method of the angles we're mapping each number between 0 and the total. This allows us to get each piece of the pie to fit. Contrary to the bar chart where we needed only heights, and each number had an x index, here we need to find the value of each number as a percentage of the whole and then multiply that value to find the value's angle in a circle.
float angle = value / total * TWO_PI;
Twitter API
The term API stands for application programming interface. It simply allows programmers to access the data and functionality of a web service like twitter.
We're going to use a Twitter library called Twitter4J to access the Twitter API.
To add the library to your sketch, download and unzip the library. Find the file twitter4j-core-2.2.5.jar and add it to your sketch. Under the sketch menu, select add file, then point to the .jar file. You can now use the Twitter4J library in your sketch.
To start we'll need to create an object of type Twitter from the library
Twitter twitter;
We'll simply name it lowercase twitter.
Now we need to initialize our Twitter object in our setup:
twitter = new TwitterFactory().getInstance();
Searching
Here is an example of how to use the twitter object to search for a term:
Notice how the twitter search method takes an object of type Query? We must first build this object before we can make a search.
Also, the QueryResult object stores the result until we use the getTweets() method which returns to us an ArrayList of Tweet objects.
This is an example of some excellent OOP programming in the library and in fact is how many data APIs operate.